Predictive Capability of U.S.
OECD Phosphorus Loading-
Eutrophication Response Models
Walter Rast, R. Anne Jones, G. Fred Lee
Mathematical models are being used with increasing frequency to estimate the responses of water bodies to changes in nutrient loadings, and to assist in developing and assessing the water quality benefits to be accrued from various eutrophication management options. Although the current models have various forms and varying degrees of complexity, two basic types of mathematical models have been developed recently for eutrophication modeling: "statistical" models and "dynamic" models.
Dynamic models consist basically of a series of interrelated differential equations which attempt to describe the biological, chemical, and physical reactions and interactions governing aquatic plant growth (usually algae), including nutrient loads and other driving forces, such as light and temperature. These equations are solved simultaneously, usually by computer, to give a quantitative expression of algal growth dynamics and other related lake responses (such as in-lake nutrient levels) over a given period. Such models are calibrated ("tuned") for a given water body by adjusting the values of the coefficients in the various equations to reflect the specific in-lake conditions for the various parameters included in the equations to the extent necessary to make model output match measured characteristics of the water body. Therefore, such models, because they were "system dependent" (that is, they must be readjusted for each water body), are not widely applicable to other water bodies having substantially different characteristics, or to the same water body if the driving force load or other characteristics are substantially changed. In addition, the data requirements for these models are usually very extensive. Because of such factors, the use of dynamic models has thus far generally been limited to site-specific examples. No dynamic model has been demonstrated to have appreciable predictive capability beyond the situations for which they were designed.
Prominent examples of dynamic models that have been developed for the North American Great Lakes include the phytoplankton model (Lake I) developed for Lake Ontario by Thomann et al.;l,2 the dissolved oxygen (DO) model developed for Lake Erie by DiToro and Connolly;3 and the phytoplankton class succession model developed for Saginaw Bay, Lake Huron, by Bierman.4
A statistical or "empirical" eutrophication model, by contrast, is basically a statistical regression that quantifies a basic cause-and-effect relationship, and does not attempt to account for or characterize every component involved in the eutrophication process. The statistical models discussed in this paper were developed by plotting the value of the chosen measure of "effect" (that is, algal production as measured by a response parameter such as chlorophyll concentration) as a function of the factor exerting primary control over algal growth (P load suitably normalized), for each in a group of water bodies, and determining the line of best fit or regression through the individual points. Such models can be viewed, therefore, as statistical approaches relating nutrient (P) inputs and resultant eutrophication-related water quality responses to these inputs. They will not provide a detailed description of in-lake nutrient or algal dynamics, but rather, are formulated to describe the steady-state or equilibrium response. The data requirements are usually much less extensive for statistical models than for dynamic models.
adequate load and response data are available for less than a dozen water bodies.
Prominent examples of recent statistical models for assessing eutrophication include those of Vollenweider;5-7 Dillon and Rigler;8 Larsen and Mercier;9 Jones and Bachmann;l0 Rast and Lee;11 Lee et al.;12 Jones and Lee;13 and Vollenweider and Kerekes.14 While all of these models are in principle the same, the Rast and Lee11,12 regressions, especially as expanded by Jones and Lee,13 have the largest, most varied data base and are hence likely to be most representative of the general case.
In this paper, the predictive capability of the "U.S. Organization for Economic Cooperation and Development (OECD)-Vollenweider-Rast-Lee and Jones" P load-response models is examined. This was done by collecting load and response data from the literature on water bodies that had undergone substantial P load reductions, both before and after the load changes. Only those water bodies with data sufficient to describe load and response characteristics both before and after loading changes were included in this analysis. The models were used to estimate the post-change equilibrium response, based on pre-change characteristics and the magnitude of load change. This prediction was then compared to the response measured after P load reduction occurred. Only by evaluating a model under substantially altered load conditions can its capability for predicting response be verified.
It must be emphasized that this analysis is not a strictly statistical exercise. Others have discussed the significance of the concept of uncertainty analysis in relation to statistical modeling efforts. The purpose of this paper is to describe the predictive capability of this statistical modeling approach by direct comparison of predicted and measured responses. It is felt that this description will have more immediate usefulness to lake or impoundment managers and decision-makers than a strictly statistical analysis. This latter aspect, however, is not to be ignored. The reader is referred to other sources for a detailed discussion of the associated statistics of this modeling approach.15-17
U.S. OECD EUTROPHICATION MODELING APPROACH
The models presented herein are an outgrowth of the Cooperative Programme on Eutrophication Control of OECD. This program was initiated to define quantifiable relationships between nutrient loads and eutrophication-related responses of water bodies, which could be used as management tools in the assessment and control of eutrophication in lakes and impoundments. Through the OECD program, a detailed evaluation was made of loadings and responses of over 200 water bodies exhibiting a variety of trophic conditions and physiographic factors in about 20 nations around the world. These water bodies were grouped into four regional projects. Approximately 34 lakes and reservoirs in the U.S. were included in the OECD-North American Project. The OECD eutrophication study program is described in detail by Rast and Lee,11 and Vollenweider and Kerekes.14
Vollenweider,5,7 as part of his work in the OECD eutrophication study program, developed overall empirical relationships between areal annual total phosphorus loads normalized by mean depths and hydraulic residence times in the expression [L(P)/(z/T)]/(1+ T)},) and annual average chlorophyll concentrations for a number of European lakes. In his loading expression, L(P) is the areal, annual total P load in mg P/m2.y , z is mean depth in m, and T is hydraulic residence time in years. The expression z/T is also given the notation qs. As discussed by Vollenweider and Kerekes,14 this normalized loading expression is theoretically equal to and can be empirically related to the mean, in-lake, steady-state total P concentration. Rast and Lee11 followed Vollenweiders approach for the U.S. OECD water bodies by relating their phosphorus loads to their chlorophyll concentrations, and deriving a regression similar to Vollenweiders. Using the U.S. OECD data base, Rast and Lee11 also developed regressions between P load (normalized by mean depth and hydraulic residence time) and Secchi depth, and between normalized P load and hypolimnetic oxygen depletion rate. These were presented and discussed by Rast and Lee11 and Lee et al.12
Since that time, the authors13 have evaluated the P load and eutrophication response characteristics of approximately 40 more water bodies in the U.S. Jones and Lee13 have slightly modified the U.S. OECD load-response regressions for Secchi depth and chlorophyll based on the addition of these water bodies but have found that these approximately 40 additional U. S. water bodies did not substantially alter the lines of best fit based on the U.S. OECD data alone. Figure 1 shows the regressions developed by Jones and Lee,13 which include the U.S. OECD data and other data evaluated by Rast and Lee.11 They are based on water bodies having a wide variety of morphologic and hydrologic characteristics and geographic locations, ranging from small, shallow lakes and impoundments, to the Great Lakes, including Lake Superior. They include water bodies with trophic conditions ranging from oligotrophic to hypereutrophic. Lee has also found that the U.S. OECD load-response relationships are applicable to the approximately 200 other OECD water bodies evaluated in the OECD eutrophication study program. As discussed in a subsequent section of this paper, Lee and Jones18 expanded this approach to develop a relationship between P load and fish yield in water bodies.
Figure 1: Phosphorus load: Eutrophication response relationships for US water bodies (after Jones and Lee13).
PROCEDURE AND ANALYSIS
The predictive capability of the U.S. OECD eutrophication modeling approach, and Jones and Lee13 regressions was examined by comparing the predicted and measured responses of water bodies subjected to substantial changes in their phosphorus loads. The authors surveyed the eutrophication literature for pertinent, requisite data to determine load-response couplings for as many such water bodies as possible for before and after the P load change. No attempt was made to select certain types or classes of water bodies. Because data for phosphorus loads and water body conditions both before and after changes in the phosphorus loads were needed, sufficient information was found for only about 15 water bodies, located in the U.S., Canada, and Sweden. A number of these water bodies were not included in this evaluation, however, because they were found to violate one or more of the significant basic premises that must be fulfilled to reliably use the OECD eutrophication modeling approach. These omissions, as well as the general conditions that must be met, are discussed in a subsequent section. Further, during preparation of this paper, a paper by Smith and Shapiro19 was published that discussed chlorophyll-phosphorus concentration relationships. Those authors sources were examined to determine if adequate P loading information was provided so their water bodies could be included in this paper. As discussed in a subsequent section, few of the water bodies discussed by Smith and Shapiro could be included herein.
The general locations, phosphorus loads, and hydrologic and morphometric characteristics of the water bodies evaluated herein are presented in Table 1. Corresponding data on chlorophyll concentrations, Secchi depth transparencies, and hypolimnetic oxygen depletion rates are presented in Table 2. The columns labeled "Pre-" and "Post-" in Table 2 refer to conditions prior to, and following initiation of phosphorus control programs, respectively.
Table 1: Summary of data on phosphorus loads and morphometric and hydrologic characteristics.
|
Lake |
Identification no. |
Location |
Phosphorus load |
Mean |
Hydraulic |
"Hydraulic |
Reference |
|
|
Pre- |
Post- |
|||||||
|
Boren |
1 |
Sweden |
35.9 |
9.98 |
6 |
0.2 |
30 |
20 |
|
Ekoln |
2 |
Sweden |
100 (1972)a |
56.8b (1974) |
20 |
0.4 |
50 |
20, 21 |
|
Gravenhurst Bay |
3 |
Ontario, Canada |
3895b |
1570c |
7.6 |
1.8 |
4.2 |
22 |
|
Haley's Pond |
4 |
Maine, USA |
0.95 |
0.24 |
2.4 |
0.13 |
19 |
23 |
|
Lower Minnetonka |
5 |
Minnesota, USA |
12.9d |
2.8 |
8.3 |
6.3 |
1.32 |
24 |
|
Ryssbysjön |
6 |
Sweden |
4.9b |
1.1b |
1.8 |
0.13 |
13.8 |
25, 26 |
|
Sammamish |
7 |
Washington, USA |
20.2 |
13.3 |
17.7 |
1.8 |
9.8 |
27, 28 |
|
Shagawa |
8 |
Minnesota, USA |
6.84 (1971) |
2.14 (1973) |
5.7 |
1.0 |
5.7 |
29, 30 |
|
Washington |
9 |
Washington, USA |
201.5 (1964) |
43.8 (1970) |
32.9 |
1.9 (1964) 3.2 (1973) |
17.7 9164) |
31, 32 |
|
Wahnbach |
10 |
West Germany |
- |
- |
- |
- |
- |
33, 34 |
a
indicates year of data for lakes with multiple data points.b indicates data were calculated or extrapolated from graphs in cited references.
c mean value of reported range.
d for summer-spring of and after reponse data rather than fall-summer of year before and including response.
Dash (-) indicates no data found.
Table 2: Normalized P loading and waterbody response parameters before and after P load reduction.
|
Lake |
(L(P)/qs)/(1 + 1/1) (mg P/m3) |
Summer mean chlorophyll a (mg/m3) |
Summer mean Secchi depth (m) |
Hypolimnetic oxygen depletion rate (g O2/m2 d) |
||||
|
Pre- |
Post- |
Pre- |
Post- |
Pre- |
Post- |
Pre- |
Post- |
|
|
Boren |
50 |
19 |
8.7 |
5.2 |
1.4 |
2.0 |
||
|
Eloln |
175 (1972)a |
88 (1974)a,b |
25 |
12 |
1.6 |
2.1 |
||
|
Gravehurst Bay |
96.1 |
38.4 |
13.8 |
5 |
1.9 |
3.9 |
0.50 |
0.25 |
|
Haley's Pond |
54.2 |
13.9 |
30 |
5.4 |
2.3 |
3.0 |
- |
|
|
Minnetonka |
106.8 |
23.1 |
26b |
13b |
1.4 |
1.8 |
- |
|
|
Ryssbysjön |
95b |
21b |
36 |
16 |
0.8 |
0.8 |
- |
|
|
Sammamish |
104 |
68 |
9.8 |
6 |
3.3 |
3.5 |
0.49 |
0.49 |
|
Shagawa |
65.2 (1971) |
20.4 (1973) |
20 |
21.2 |
- |
- |
- |
|
|
Washington |
55 (1964) |
14.2 (1970) |
34.8 |
8.8 |
1.0 |
2.5 |
- |
|
|
Wahnbach |
51 (1969) |
10 (1978) |
25 |
8 |
- |
- |
- |
|
Dash (-) indicates data not available.
a indicates year of data for lakes with multiple data points.
b indicates data were calculated or extrapolated from graphs in cited reference.
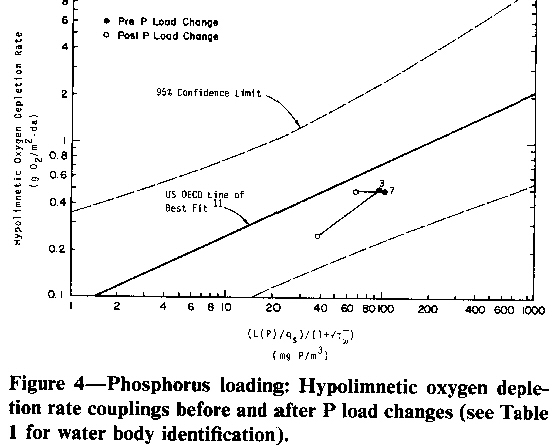
Figures 2, 3, and 4 show the normalized P load-response regressions for U.S. water bodies with the load-response couplings for each considered herein for "before" and "after" P load changes. The predicted value for the post P load change condition is at the intersection of a line drawn through the "pre-change" point parallel to the overall line of best fit, and a vertical line drawn through the "post-change," equilibrium, normalized P loading.
DISCUSSION
Several things are immediately evident from examination of Figures 2, 3, and 4. First, the measured load-response couplings for any water body tend to maintain a fairly constant linear distance from the line of best fit. In other words, the load-response coupling for a water body tends to move parallel to the line of best fit in response to changes in the P loading term for it. (This is the basis for the procedure used to predict post-change response.) Second, in most cases the load-response couplings lie within 95% confidence intervals about the regression lines. These observations are even more striking when it is recalled that the water bodies included herein were not specifically chosen, but rather represented the data from all water bodies for which sufficient information could be found to make this evaluation.
A comparison of the measured and predicted values for water quality response parameters based on Figures 2, 3, and 4 is presented in Table 3. Most of the predicted chlorophyll and Seechi depth values are within a factor of 2 of the measured values, while nearly all predicted values are within a factor of 3. The measured hypolimnetic oxygen depletion rate values are within a factor of 2 of the predicted values, although there were only two water bodies with sufficient data for this parameter available.
Table 3: Comparison of measured and predicted water quality characteristic responses to phosphorus load reduction.
|
Lake |
Summer mean chlorophyll a ( mg/L) |
Summer mean Secchi depth |
Hypolimnetic oxygen depletion rate (g O2/m2 d) |
||||||
|
Measured |
Predicted |
PMa |
Measured |
Predicted |
PMa |
Measured |
Predicted |
PMa |
|
|
Boren |
5.2 |
4.0 |
0.77 |
2.0 |
2.5 |
1.2 |
- |
- |
- |
|
Ekoln |
12 |
14 |
1.2 |
2.1 |
2.2 |
1.0 |
- |
- |
- |
|
Gravenhurst Bay |
5.0 |
6.6 |
1.3 |
3.9 |
2.9 |
0.74 |
0.25 |
0.33 |
1.3 |
|
Haley's Pond |
5.4 |
9.9 |
1.8 |
3.0 |
4.15 |
1.4 |
- |
- |
- |
|
Lower Minnetonka |
13 |
6.6 |
0.51 |
1.8 |
2.8 |
1.6 |
- |
- |
- |
|
Ryssbsyjön |
16 |
10.5 |
0.66 |
0.8 |
1.6 |
2.0 |
- |
- |
- |
|
Sammamish |
6 |
7 |
1.2 |
3.5 |
4.0 |
1.1 |
0.49 |
0.4 |
0.82 |
|
Shagawa |
21.2 |
7.7 |
0.36 |
- |
- |
- |
- |
- |
- |
|
Washington |
6.1 |
9 |
1.5 |
3.5 |
2.15 |
0.61 |
- |
- |
- |
|
Wahnbach |
8 |
6.6 |
0.82 |
- |
- |
- |
- |
- |
- |
a
PM = Predicted value ¸ Measured valueDash (-) indicates no data found.
Based on these results, it appears that from the point of view of lake management, the statistical models presented above have considerable validity and usefulness as quantitative tools for assessing the expected water quality responses of lakes and impoundments to changes in their phosphorus loads. However, in some cases, measured values deviated somewhat from predictions based on the regression lines in the three models (Figures 2, 3, and 4). This deviation is related to a variety of factors, both general and site-specific, as discussed below.
General considerations
. There are several conditions that generally must be met before the U.S. OECD eutrophication models presented herein should be applied to any water body. A principal prerequisite is that maximum summer algal biomass in the water body be limited by phosphorus. Some investigators still occasionally use the N to P ratio alone for determining the limiting nutrient. Others use the results of standard laboratory algal assay "bottle tests." Lee and Jones35 discuss why neither of these approaches alone or together is sufficient or technically defensible for this purpose. They offer guidance on determining the limiting nutrient and on how this information should be used in eutrophication management. As they point out, more important than an N to P ratio, or the results of an algal growth potential study, is whether or not the available N or available P in the water body is reduced to growth-limiting levels during the period of eutrophication-related water quality concern. It has also been found that if water bodies are close to P limitation, they also appear generally to follow the correlations presented herein. This is consistent with Schindlers36 remarks concerning the ultimate control of algal biomass production by phosphorus, even in water bodies in which nitrogen appears to be limiting growth.Another necessary condition for the proper application of the U,S, OECD eutrophication models is that aquatic plant growth be manifested primarily as planktonic algae, rather than as attached algae or aquatic macrophytes. Further, only moderate amounts of non-algal turbidity or color should be present. Also, the hydraulic residence time during the growing season must be at least 2 weeks (0.04 year) to allow time for algae to grow. While adaptations of these models are being developed for N-limited water bodies and for those with water quality problems related to aquatic macrophytes, the models presented here should not be relied upon for those situations. Other assumptions inherent in the OECD eutrophication modeling approach necessitate that the water bodies behave like completely mixed reactors; that they have constant volumes; and that P sedimentation is proportional to in-lake concentration.7,11,14 Some adjustments can be made if some of these assumptions are not met, such as in a case where the volume is known to fluctuate over an annual cycle.
These assumptions are generally sufficiently met in most water bodies, as evidenced by the fact that the OECD eutrophication modeling approach has been found applicable to the approximately 300 water bodies evaluated to date. In other cases, the water bodies have been found to have a peculiarity that precludes their fitting the correlations, and the water bodies evaluated here generally track along the lines of best fit when P loading characteristics are changed. However, the load-response coupling for a given water body may deviate somewhat from the U.S. water body lines of best fit. Because all data evaluated herein were derived from the literature, some of which was not wholly directed on the focal point of the current study, it was not possible in every case to assess if these assumptions and conditions were met. Water bodies for which pre- and post-P load change data were available, but which were known not to meet one of these significant conditions, were intentionally not included in this evaluation. For example, while pre- and post-P load change data were available for Lakes Gåran and Ranisjön in Sweden (the latter of which was included in the Smith and Shapiro19 study), the authors26 indicated that these water bodies were not P limited. Lake Uttran (Sweden) experienced an increase in chlorophyll concentrations after the diversion of municipal wastewaters from the lake. Investigators21,37 have indicated that unusually strong winds during the summer stirred up the sediments more than usual, increasing the nutrient input from the sediment. On a similar note, a number of "lake restoration" techniques were applied to Lake Norrviken (Sweden), making it difficult to sort out the impact of P load reduction alone on eutrophication-related water quality.
It was also not possible to be certain that all data used in this evaluation were comparable. In some cases it was necessary to obtain data by interpolation from graphed data or to use loading term [(L(P)/qs)/( 1 + T] values determined by the authors of the referenced studies. Data for water bodies that were sampled more frequently during the summer growing season were likely to be more accurate in defining summer in-lake conditions than for those less frequently sampled. Further, because only limited amounts of peripheral information regarding the water bodies existed, namely detailed water inflow patterns, morphological and aquatic plant-related characteristics, and other changes, such as a decrease in other contaminant loads, the data presented could not be screened as Lee and Jones13,38 recommend and loads could not be independently verified. It was also not possible to determine if errors were made in collecting water samples, or in measuring the parameters of concern.
It must also be recognized that the response of a water body to a reduction in phosphorus load will not be immediate. Rather, a delay in characteristic, during which in-lake phosphorus concentrations and the resultant response parameters are adjusting to the new phosphorus load and will not be in an equilibrium condition. The above models predict steady-state conditions. Assuming no additional significant change in the phosphorus load occurs, a lake or impoundment will move toward a new steady-state condition in an exponential manner.5,7,11,39 In accordance with this exponential function, the new steady-state condition will be 95% achieved in a time period equal to three times the phosphorus residence time. It is important to point out that although the chemical residence time of a conservative chemical is the same as its hydraulic residence time, for a non-conservative chemical like phosphorus, the chemical residence time is normally shorter than the water residence time. Hence, it is inappropriate to make estimations of "recovery" time for water bodies eutrophication-related response characteristics based on the hydraulic residence time, as some attempt to do. It is the residence time of P in the water body that governs response time of a water body to a change in phosphorus load. In a manner analogous to the hydraulic residence time, the phosphorus residence time can be calculated as the annual average in-lake phosphorus mass divided by the annual phosphorus mass input.
To be technically proper, the post-P load change data must represent the new steady-state conditions. In the evaluation presented in this paper, however, it was not possible in most cases to determine phosphorus residence time. Furthermore, there was substantial year-to-year variability in the phosphorus loads for the water bodies with multiple data points. Hence, the degree to which steady-state conditions had been achieved in each case (following phosphorus load reductions) was not clear. While Schindler40 has stated that there is little practical reason to expect extensive time lags in the phytoplankton responses of most water bodies to reduced phosphorus loads, it is possible that some of the variance shown in Figures 2 through 4 relates to the fact that relatively steady-state conditions had not been achieved in all cases. It is also important to understand that there is typically considerable year-to-year variability in P mass input to a water body and in hydraulic load that affect residence time, as demonstrated in a study of Lake Lillinonah, Conn., on the Housatonic River.41 In most cases evaluated herein, only one years data were available to describe "before" conditions. It was not possible to assess how representative this condition was or if any other load alterations were made prior to that time. Rast and Lee11 found that, based on U.S. OECD data, the phosphorus residence time generally decreases as the degree of eutrophy increases. This suggests that eutrophic lakes will respond more rapidly to phosphorus control measures than less productive water bodies.
Some deviation from the expected behavior of the lakes in Figures 2, 3, and 4 may also be related to the fact that the models are based on total phosphorus loads. It is known that appreciable portions of the total P loads to some water bodies, especially from non-point sources, are in forms that are unavailable for uptake and use by planktonic algae. This P availability factor is usually normalized in the design of the models.42 But when an unusually large part of the P load is particulate, or otherwise not readily available, use of the total P load in the U.S. OECD models will cause the water body to plot farther to the right than expected. Similarly, if an unusually large part of the P load reduction was caused by reducing the amounts of unavailable P, the measured responses for the water body would not be as large as predicted. Adjustments in the total P load can be made for such water bodies if sufficient information is available. But, because only the total P loads were reported for the majority of the lakes and impoundments evaluated, this factor may have also contributed to variations seen in Figures 2 through 4. Lee et al.42 provide further discussion of P availability and its implications for water quality management.
It has been intimated that the U.S. OECD models may not be applicable in their present forms to lakes or reservoirs exhibiting stratified inter- or under-flow (density currents) that could inhibit nutrients in the inflow waters from interacting with algal populations in the euphotic zone. It was thought that because of this "shortcircuiting," it may be necessary to modify the hydraulic and phosphorus residence time expressions or the loading term to compensate. However, Newbry et al.43,44 found that the dozen or so Tennessee Valley Authority (TVA) reservoirs on which data were available to them, many of which are known to exhibit or were suspected of exhibiting this phenomenon, follow the U.S. water body load-response relationships. They43,44 noted that an important factor governing the potential impact of this phenomenon on algal growth is the time of year in which it occurred. For the water body intensively investigated by them (Cherokee Reservoir), the stratified flow occurred late in the summer growing season and did not apparently affect summer phosphorus utilization.
The observed, general variance of the points in Figures 2, 3, and 4, and reflected in Table 2, from the water body response expected is undoubtedly related to the above-mentioned factors. However, in view of the fact that the data used herein could not be screened to a substantial extent, the fit and behavior of water bodies compared with what is predicted is remarkable.
Site-specific considerations
. Several U.S. water bodies have gained reputations for "failing" to respond to nutrient load reductions to the degrees investigators had anticipated.30,45 One of these is Lake Sammamish, Wash. It is frequently said that this lake did not recover to the degree it should have based on the phosphorus load reductions that took place. A variety of mechanisms, usually involving iron chemistry or sediment release, have been invoked to explain this.45 While Lake Washington, Wash., to which Lake Sammamish is often compared, has demonstrated a significant improvement in its eutrophication-related water quality as a result of diversion of domestic wastewater from it, Lake Sammamish has not shown similar improvement after a similar type of control measure.45 Figure 2 shows that both Lake Sammamish (No. 7) and Lake Washington (No. 9) responded as predicted based on their respective P load reductions. There does not appear to be a need to speculate on "unusual" lake characteristics, such as unusually high internal P load, iron as a controlling factor, or anything else, to explain the response of Lake Sammamish to its P load reduction. It appears that these factors have no greater influence on this lake than they do on other water bodies throughout the world.Figure 2: Phosphorus Loading-Chlorophyll Couplings before and after P Load Changes.
Lake Shagawa is another water body frequently cited as having failed to respond properly to P load reductions. According to Porcella et al ,46 the lake has responded as expected for the spring algal bloom. However, they pointed out that the summer planktonic algal chlorophyll levels have changed little in response to the P load reductions. Figure 2 also shows that Lake Shagawa (No. 8) has not shown a significant change in planktonic algal chlorophyll with the P load reduction. The year-to-year variations in chlorophyll levels, however, seem to be fairly substantial. Lee, in discussions with Larsen concerning the Larsen et al.30 paper, pointed out that the morphologic characteristics of Lake Shagawa are such that it would not be expected to show a normal load-response relationship. This is a result of the fact that the thermocline in this lake is not stable during the summer. High winds can readily destroy the thermocline and thereby bring significant amounts of P derived from the sediments from the hypolimnion to the photic zone. In most water bodies the thermocline is either more or less stable during the summer growing season, or the water bodies are too shallow to stratify and allow appreciable P accumulation to occur in the hypolimnion. It is evident from the Lake Shagawa situation that water bodies that have morphologies that permit thermocline development for appreciable parts of the summer (several weeks to a month or more), followed by mixing of the P accumulated in the hypolimnion into the surface water during the summer growing season, may not follow typical load-response relationships.
Another apparent misconception that exists in eutrophication management is that shallow, highly eutrophic lakes do not respond to P load reductions. It is alleged that the high P regeneration from sediments (high internal load) "prevents" or "substantially delays" recovery. However, as discussed previously, the rate of recovery of lakes following P load alteration can be reliably predicted based on the water bodys P residence time. Sonzogni et al.39 showed that the rates of recovery of the lower Madison lakes to Madison, Wis., wastewater diversion were as predicted by their P residence time model. These water bodies are highly eutrophic and are so shallow that their thermoclines persist for no more than a few days at a time. The OECD eutrophication modeling approach appropriately considers the impact of a water bodys depth through the mean depth normalizing factor (see Vollenweider7 for the basis of this approach).
Finally, to circumvent potential confusion in the literature, it is worthwhile to note the reasons these authors have excluded certain water bodies (not previously mentioned) evaluated by Smith and Shapiro9 from their analysis. The nutrient control program for Clines Pond involved in-lake treatment that, while impacting the in-lake P concentration (which is what was evaluated by Smith and Shapiro), did not alter the P load (which is the driving force used for the U.S. OECD models). The restoration technique used for Green Lake was dilution of nutrient input. The U.S. OECD models could be used to estimate the potential impact of this measure through the P loading and hydraulic residence time terms. However, not enough loading and hydraulic residence time information was provided by the original data source or Smith and Shapiro for this to be accomplished. For Browns Bay of Lake Minnetonka, Little Otter Bay, East Twin and West Twin Lakes, and Lakes Edssjon and Oxundasjiön, cited by Smith and Shapiro, insufficient before and/or after P load change or response data were provided. Finally, the authors found no evidence of a major P load change to Loch Leven other than year-to-year variability, as was also noted by Smith and Shapiro.19 While it would have been of interest to these authors to compare the load-response couplings for this water body to their U.S. water body lines of best fit, hydraulic residence time data for this water body could not be readily located or calculated.
With respect to the evaluation approach used by Smith and Shapiro19 and others, it is important to emphasize that it is more appropriate to use load-response, rather than nutrient concentration-response relationships when evaluating the potential impact of altering a water bodys P load because the former technique provides an estimate of the steady-state or ultimate response. The reliability of the use of P concentrations for evaluating the water quality impact of a P load reduction, such as was done by Smith and Shapiro,19 is largely dependent on the degree to which the water body has approached steady-state conditions at the time of measurement. Further, to predict the impact of a load alteration using in-lake P concentrations necessitates the use of additional models to derive P concentration changes that would occur as a result of P load alterations. However, an empirical relationship has been found by the authors between the normalized P loading term [(L(P)/qs)/( 1 + T)] and the mean, in-lake, steady-state P concentration:
where
(L(P)/qs)/(l+T) = normalized P loading term previously defined.
This relationship is essentially the same as that found by Vollenweider and Kerekes14 for the overall OECD water body data base. It should be noted, however, as discussed subsequently, that in-lake P concentrations should not be used as a response parameter when the concern is water quality management. Further, P concentration data, such as those presented by Smith and Shapiro,19 should not be mechanically converted to P load via Equation 1 or the Vollenweider and Kerekes14 equation and used for estimating or evaluating lake response. Since these equations were developed for steady-state conditions, they should not be applied to P concentrations measured before a period equal to three times the P residence time for the water body has passed; that is, before the water body has essentially reached a new equilibrium or steady state.
IMPLICATIONS FOR EUTROPHICATION MANAGEMENT
It should be recognized that the eutrophication process is a complex phenomenon affected by a number of physical, chemical, biological, and social factors. The present-day focus on phosphorus control has been brought about by the fact that in the majority of lakes and impoundments, and even in some estuarine systems, it is P that limits the maximum planktonic algal biomass produced during periods of water quality concern. Perhaps more significant in the focus on P control is that P control options are more readily available, socially acceptable, and inexpensive than other potential focal points. Even in those water bodies in which P does not control maximum summer biomass production, if P can be reduced to a sufficient extent, the system can often be forced to P limitation and hence, become responsive to P load reduction. There are those who go so far as to indicate that P is the underlying control of eutrophication, even in N-limited waters.36 In any event, it is evident that until the control of other factors becomes less expensive and more effective, P will be and should be the focal point of general eutrophication control.
As discussed by Rast and Lee,11 it is obvious from examination of the load-response correlations presented herein, that a substantial change in the P-loading term [(L(P)/qs)/(1 + T)] must be effected before an analytically detectable, much less visually noticeable, change in chlorophyll, Secchi depth, or oxygen depletion rate will be noted. It is essential, therefore, when contemplating enacting a P control measure aimed at reducing these response characteristics, that the P input decrease be sufficient to provide a real improvement in water quality characteristics. The models described in this paper will render a quantitative assessment of the expected improvement. The results of this study have demonstrated the ability of the U.S. water body lines of best fit to predict planktonic algal response to altered P loading with sufficient accuracy for management decisions. That is, in general, the differences between the estimated and actual concentrations of chlorophyll or values for Secchi depth are not sufficient to cause different decisions to be made regarding P load reduction. Now, instead of water quality managers "hoping for" an improvement in water quality-beneficial uses to result from a given P control program, they can determine what change will occur (as a new steady state is approached) and evaluate whether or not the proposed action will be worthwhile.
Extreme care should be exercised in the use of any model to predict changes in water quality. The "mechanical" application of a model including those described herein, without regard to a water bodys peculiarities or to the appropriateness of the assumptions of the models, can result in erroneous predictions and conclusions. Smith and Shapiro19 have recently re-emphasized this point.
Proper consideration should be given, in the evaluation of any P control program, to the desired goals of the control. As discussed by Lee et al.,47 "water quality" cannot be judged solely by the concentrations of contaminants--in this case, phosphorus--in a water body. Phosphorus does not adversely affect much unless it produces undesirable growths of aquatic plants. Chlorophyll concentration, Secchi depth, or oxygen depletion rate, while they are response parameters and are "water quality characteristics," often cannot be used alone for assessing water quality, either. For example, it is well known that significant reductions in the phosphorus load to Lake Washington have resulted in a decrease in the chlorophyll level and an increase in the mean Secchi depth transparency in the lake.48 At the same time, however, the increased water transparency has also resulted in an increase in the standing crops of attached algae and macrophytes in the lake. It is reported that although the phytoplankton levels have decreased in the lake, growth of the macrophyte Eurasian milfoil has increased to the point that it is significantly interfering with the recreational use of the water in a number of bays in the lake.49 These nuisance growths have progressed to the point that both mechanical harvesting and herbicides are being used in an attempt to alleviate them. A general increase in the macrophyte population was also seen in Lake Shagawa following reductions in the phosphorus load to this lake.50 It was reported that the increased macrophyte population had resulted in reduced walleye and yellow perch populations and increased populations of northern pike, because of habitat alterations. Such secondary effects could not be predicted with the phosphorus loading models described above, although specific examination of the water body for substrate characteristics, areas of shallow water, and other features may have shed light on this outcome. This points again to the importance of not blindly applying the U.S. OECD models and of understanding the potential limitations of the predictions if only the basic information needed for model input is available for a water body.
Further, rather than being based solely on the values of water quality characteristics, water quality must be judged in terms of desired beneficial uses of a specific water body. Vastly different eutrophication control measures may be appropriate for a water body that users enjoy for its aesthetically pleasing (that is, clear) water (such as Lake Tahoe), and one used as a warmwater sports fishery. With regard to the latter case, as noted previously, the authors have derived a P load-fish yield response relationship, the same in principle as those described herein.18 While not as well developed or well evaluated, the general relationship is clear; the greater the P load, the greater the fish yield. Eutrophication control is, then, a trade-off to some extent between aesthetics and fishability. Although caution must be exercised in using concentration values as cut-off marks for water quality characterizations, Jones and Lee13 do present general guidelines for the use of the numeric values for water quality characteristics as a means of assessing recreational-aesthetic water quality. But as they point out, the value ranges and "classifications" they present should be used only as a guide, not as a fixed-number classification/decision-making system.
In assessing the "goodness of fit" or the adequacy or accuracy of the predictions of a eutrophication model for water quality management, it is important to keep in mind the purpose of the modeling effort, the sensitivity of the management decision to model output, and the detectability of the response parameter by the public. For example, a models predicting that the average chlorophyll level will decrease from 50 to 25 �g/L is, for management purposes, essentially the same as its predicting a decrease to 20 or 35 �g/L because the eutrophication-related water quality characteristics generally of greatest concern are similar at all of these levels. However, a predicted decrease from 20 to 5 �g/L chlorophyll may evoke a different decision than that which would be made if the decrease were predicted to be to 10 �g/L because the public can generally see a difference in characteristics between waters having 5 and 10 �g/L average chlorophyll. This concept is discussed further by Jones and Lee.13
In spite of the above precautions and considerations, it is clear, from the perspective of lake management, that the statistical phosphorus load-lake response models of the type discussed above represent considerable steps forward in the development of effective quantitative tools for predicting and assessing the water quality impacts of phosphorus control programs for combatting eutrophication. The results of the U.S. portion of the North American Project,11 as well as of the overall OECD Cooperative Programme,14 indicate that the nutrient load-lake response models of the type described here can be applied successfully to practical management of water bodies as long as water quality managers remain aware of the shortcomings and limitations of the study itself, and the conditions under which the models should and should not be applied.
It is noteworthy that the statistical modeling approach described above has been used already in a number of situations and has been found to be a very satisfactory predictive tool in comparison with other modeling efforts. Simons and Lam51 for example, have compared the predictive capability of a simple input-output model based on Vollenweiders7 mass balance approach, with that from a more elaborate, two-layer, two-component model and concluded that the two models appear to have an equivalent predictive capability for the overall response of a lake to changing phosphorus loading conditions. An even more impressive example is provided by Bierman52 and Vallentyne and Thomas,53 who compared the predictions of five different models, including the approach of Vollenweider,7 in setting phosphorus loading objectives for the North American Great Lakes. Bierman52 concluded that, although the data for the initial conditions were not equivalent in all cases, all the models for a given lake gave comparable results for the desired in-lake water quality conditions. The phosphorus loading objectives produced as a result of this modeling effort, in fact, have since been designated by the governments of the U.S. and Canada as phosphorus target loads for the North American Great Lakes.54
Lee et al.55 discussed an interesting application of the predictive capability of these models to evaluate the change in water quality characteristics (specifically, hypolimnetic oxygen depletion) of Lake Mendota, Wis., between the early 1900s and present. Based on the U.S. waterbody line of best fit (Figure 4), current oxygen depletion rates and P loading, and the reported oxygen depletion rates for 1906-1909, an estimate was made of the P load in 1906-1909. This loading and a literature value for Secchi depth for 1916 was plotted on the P loading-Secchi depth model (Figure 3). It was found to plot close to the line of best fit. Even more remarkable was the fact that this coupling was "up" the line of best fit from Lake Mendotas current position, giving credibility to the assumptions made. Such a "retrospective" approach can be useful in defining the water quality of a water body at some time in the past (by knowing changes in land use) or in determining the impact certain activities of the past may have had on water quality. In the case of Lake Mendota, it was used to conclude that the demise of the cold water fish, cisco, was the result of increased development of the Lake Mendota watershed principally as increased urban area and more intensive agriculture. The land-use changes increased the P loading, which produced greater amounts of phytoplankton, which in turn increased the rate of deoxygenation of the hypolimnion immediately below the thermocline, which finally made this water (the cisco niche) uninhabitable for them.
Figure 4: Phosphorus Loading: Hypolimnetic oxygen depletion rate couplings before and after P load changes.
Smith and Shapiro19 have discussed the efficacy of empirical models for assessing eutrophication in water bodies. They have examined the relationship between the in-lake total P and chlorophyll concentrations in several water bodies in the U.S., Canada, and Sweden (most of which are included herein) and concluded that reduction in the total P concentrations in these water bodies are typically accompanied by consistent declines in their chlorophyll levels, although they have also expressed the view that all water bodies do not respond in an "identical" manner to P reductions, and that the "unique" responses of each lake will contribute to the variability of such models. Rast and Lee56 and these authors concur in these basic conclusions although Rast and Lee56 also point out problems inherent in both the data base and the analyses of Smith and Shapiro. When such problems are appropriately considered in the analyses, Rast and Lee have concluded that, for the purpose of lake management, the Smith and Shapiro19 relationships present adequate predictions within well-defined confidence intervals. In addition, it should be recalled that the P loading term [(L(P)/qs)/(1 +T] defines the predicted in-lake, steady-state total P concentrations7 within the statistical limitations defined by Vollenweider and Kerekes.14 Accordingly, if the P loading term were substituted for the average in-lake total P concentration (after appropriate data transformation) in the graphs of Smith and Shapiro, the resulting correlation would likely be similar to the P load-chlorophyll correlation expressed in Figure 2. The reader is referred to Rast and Lee56 for a more detailed discussion analysis of the work of Smith and Shapiro within the context of water body management for the effective control of eutrophication. Implications for Section 314A lake restoration.
ACKNOWLEDGMENTS
Credits.
The authors wish to thank R. Vollenweider, Canada Center for Inland Waters, Burlington, Ontario, and C. Forsberg, Uppsala University, Uppsala, Sweden, for their review of and comments on this paper. The assistance of H. Bernhardt, Postfach, West Germany, in providing information on Wahnbach Reservoir, and of S.O. Ryding, Uppsala University, Uppsala, Sweden, in providing comments on the paper and information on several Swedish lakes is also acknowledged. Support for preparation of this paper was provided by the Department of Civil Engineering and Water Resources Center, Texas Tech University, Lubbock, Tex..Authors.
W. Rast is a scientist with the U.S. Geological Survey, Sacramento, Calif. At the time of preparation of this paper, he was an environmental scientist with the International Joint Commission, Washington, D.C. R. Anne Jones is a research associate and lecturer in the Department of Civil Engineering at Texas Tech University. G. Fred Lee is professor of civil engineering at Texas Tech University, Lubbock. Correspondence should be addressed to G. Free Lee, Dept. of Civil Engineering, Environmental Engineering Program, Box 4089, Lubbock, TX 79409.REFERENCES
1. Thomann, R. V., et al., "Mathematical Modeling of Phytoplankton in Lake Ontario. I. Model Development and Verification." U.S. Environ. Prot. Agency, EPA-660/3-75-005, Corvallis, Ore. (1975).
2. Thomann, R.V., et al., "Mathematical Modeling of Phytoplankton in Lake Ontario. II. Simulations Using Lake I Model." U.S. Environ. Prot. Agency, EPA-660/3-76-065, Duluth, Minn. (1976).
3. DiToro, D.M., and Connolly, J.F., "Mathematical Models of Water Quality in Large Lakes. Part II. Lake Erie." U.S. Environ. Prot. Agency, EPA-600/3-80-065, Duluth, Minn. (1980).
4. Bierman, V.J., and Richardson, W.L., "Mathematical Model of Phytoplankton Growth and Class Succession in Saginaw Bay, Lake Huron." In "Water Quality CriteriaResearch of the U.S. EPA." Proc. of EPA Symposium, U.S. Environ. Prot. Agency, EPA-600/3-76-079, Corvallis, Ore. (1976).
5. Vollenweider, R.A., "Possibilities and Limits of Elementary Models Concerning the Budgets of Substances in Lakes." Arch. Hydrolobiol., 66:36 (1969).
6. Vollenweider, R. A., "Input-Output Models with Special Reference to the Phosphorus Loading Concept in Limnology." Schweiz. Z. Hydrol., 37:53 (1975).
7. Vollenweider, R.A., "Advances in Defining Critical Loading Levels for Phosphorus in Lake Eutrophication." Mem. Inst. Ital. Idrobiol., 33:53 (1976).
8. Dillon, P.J., and Rigler, F.H., "A Test of a Simple Nutrient Budget Model Predicting the Phosphorus Concentration in Lake Water." J. Fish. Res. Bd. Can., 31:1771 (1974).
9. Larsen, D.P., and Mercier, H.T., "Phosphorus Retention Capacity of Lakes." J. Fish. Res. Bd. Can., 33:1742 (1976).
10. Jones, J.R., and Bachmann, R.W., "Prediction of phosphorus and chlorophyll levels in lakes." J Water Pollut. Control Fed., 48:2176 (1976).
11. Rast, W., and Lee, G.F., "Summary Analysis of the North American (U.S. Portion) OECD Eutrophication Project: Nutrient Loading-Lake Response Relationships and Trophic State Indices." U.S. Environ. Prot. Agency, EPA-600/3-78-008, Corvallis, Ore. (1978).
12. Lee, G.F., et al., "Eutrophication of Waterbodies: Insights for an Age-Old Problem." Environ. Sci. & Technol., 12:900 (1978).
13. Jones, R.A., and Lee, G.F., "Recent Advances in Assessing Eutrophication for Water Quality Management."J. Water Res., 16:503 (1982).
14. Vollenweider, R.A., and Kerekes, J.J., "Synthesis Report: Cooperative Programme on Monitoring of Inland Waters (Eutrophication Control)." Report prepared for the Organization for Economic Cooperation and Development (OECD), Paris (1980).
15. Reckhow, K.H., "Uncertainty analysis applied to Vollenweiders phosphorus loading criterion." J. Water Pollut. Control Fed, 51:2123 (1979).
16. Reckhow, K.H., and Simpson, J.T., "A Procedure Using Modeling and Error Analysis for the Prediction of Lake Phosphorus Concentration from Land Use Information."Can. J. Fish. Aquat. Sci., 37:1439 (1980).
17. Reckhow, K.H., et al., "Modeling Phosphorus Loading and Lake Response Under Uncertainty: A Manual and Compilation of Export Coefficients." U.S. Environ. Prot. Agency, EPA-440/5-80-01 1, Washington, D.C. (1980).
18. Lee, G.F. and Jones, R.A., "Effect of Eutrophication on Fisheries." Submitted for publication (1981).
19. Smith, V.H.. and Shapiro, J., "Chlorophyll-Phosphorus Relations in Individual Lakes. Their Importance to Lake Restoration Strategies." Environ. Sci. Technol., 15:444 (1981).
20. Forsberg, C., et al., "Research on Recovery of Polluted Lakes. I. Improved Water Quality in Lake Boren and Lake Ekoln after Nutrient Reduction." Verh. Int. Verein. Limnol., 20: 825 (1978).
21. Ryding, S.O., Statens Naturvårdsverk, Vattenlaboratoriet Uppsala, Sweden. Personal communication to G. Fred Lee (1981).
22. Michalski, M.F.P., et al., "Phosphorus Removal and Water Quality Improvements in Gravenhurst Bay, Ontario." Verh. Int. Verein. Limnol., 19:644 (1975).
23. Bailey, I. H., et al.. "Response of Haley Pond, Maine, to changes in effluent load." J. Water Pollut. Control Fed, 51:728 (1979).
24. Megard, R.O., "Phytoplankton, Phosphorus, and Sewage Effluents in Lake Minnetonka." In Seyb, L., and Randolph, K., (Eds.), "North American Project--A Study of U.S. Water Bodies." U.S. Environ. Prot. Agency, EPA-600/3-77-086, Corvallis, Ore. (1977).
25. Forsberg, C., et al., "Recovery of Polluted Lakes. A Swedish Research Program on the Effects of Advanced Waste Water Treatment and Sewage Diversion." Water Res., 9: 51 (1975).
26. Ryding, S.O., and Forsberg, C., "Six Polluted Lakes: A Preliminary Evaluation of the Treatment and Recovery Processes." Ambio, 5:151 (1976).
27. Welch, E.B.. et al., "Nutrient Loading and Trophic State of Lake Sammamish, Washington." In Seyb, L., and Randolph, K. (Eds.), "North American Project--A Study of U.S. Water Bodies." U.S. Environ. Prot. Agency, EPA-600/3-77-086, Corvallis, Ore. (1977).
28. Welch, E.B., "Nutrient Diversion: Resulting Lake Trophic State and Phosphorus Dynamics." U.S. Environ. Prot. Agency, EPA-600/3-77-003, Corvallis, Ore. (1977).
29. Malueg, K. W., et al., "An Overview of Limnological Characteristics of Shagawa Lake, Minnesota." In Seyb, L. and Randolph, K. (Eds.), "North American Project--A Study of U. S. Water Bodies." U.S. Environ. Prot. Agency, EPA-600/3-77-086, Corvallis, Ore. (1977).
30. Larsen, D.P., et al., "The Effect of Wastewater Phosphorus Removal of Shagawa Lake, Minnesota: Phosphorus Supplies, Lake Phosphorus, and Chlorophyll a." Water Res., 13: 1259 (1979).
31. Edmondson, W.T., "Lake Washington." In Seyb, L., and Randolph, K. (Eds.), "North American Project--A Study of U.S. Water Bodies." U. S. Environ. Prot. Agency, EPA-600/3-77-086, Corvallis, Ore. (1977).
32. Edmondson, W. I., "Trophic Equilibrium of Lake Washington." U.S. Environ. Prot. Agency, EPA-600/3-77-087, Corvallis, Ore. (1977).
33. Clasen, J., "The Aim of Phosphorus Removal at the Main Tributary of Wahnbach Reservoir Regarding Oligotrophication." Proc. of Symp. des Wahnbachtalsperrenverbandes, Siegburg, 65 (September 1978).
34. Bernhardt, H., Wahnbachtalsperrenverband, Siegburg, W. Germany. Personal communication to G. Fred Lee (1979).
35. Lee, G.F. and Jones, R.A., "Determination of Nutrient Limiting Maximum Algal Biomass in Waterbodies."AWWA Quality Control in Reservoirs Committee Report. Accepted for publication.
36. Schindler, D. W., "Evolution of Phosphorus Limitations in Lakes." Science, 195: 260 (1977).
37. Ryding, S.O., "Research on Recovery of Polluted Lakes. Loading, Water Quality and Responses to Nutrient Reduction." Ph.D. dissertation, Institute of Limnology, Uppsala Univ., Uppsala, Sweden (1978).
38. Lee, G.F., and Jones, R.A., "Study Program for Development of Information for Use of OECD Modeling in Water Quality Management." AWWA Quality Control in Reservoirs Committee Report. Accepted for publication.
39. Sonzogni, W.C., et al., "The Phosphorus Residence Time Model." Water Res., 10:429 (1976).
40. Schindler, D.W., "Predictive Eutrophication Models." Limnol & Oceanogr., 23:1080 (1978).
41. Jones, R.A., and Lee, G.F. "Impact of Phosphorus Removal at the Danbury, Conn. Sewage Treatment Plant on Water Quality in Lake Lillinonah." Water, Air, and Soil Pollut., 16: 511 (1981).
42. Lee, G.F., et al., "Availability of Phosphorus to Phytoplankton and Its Implications for Phosphorus Management Strategies." In "Phosphorus Management Strategies for Lakes." Ann Arbor Press, Ann Arbor, Mich. (1980).
43. Newbry, B.W., et al., "Assessment and Analysis of Eutrophication of Tennessee River System Impoundments." Proc. Symp. on Surface Water Impoundments ASCE, June 1980, Minneapolis, Minn. (1981).
44. Newbry, B.W., et al., "Application of the OECD Eutrophication Modeling Approach to Cherokee Reservoir and Other TRS Impoundments." Report to the Tennessee Valley Authority, Chattanooga, Tenn. (1979).
45. Welch, E.B., et al., "Long-Term Lake Recovery Related to Available Phosphorus." In "Modeling the Eutrophication Process." Proc. workshop Utah State Univ., Sept. 1973, Utah Water Res. Lab., Utah State Univ., Logan (1973).
46. Porcella, D. B., et al., "Index to Evaluate Lake Restoration." J. Environ. Engr. Div., ASCE, 106:1151 (1980).
47. Lee, G.F., et al., "Water quality standards and water quality." J. Water Pollut. Control Fed., 54:1131(1982).
48. Edmondson, W.T., and Lehman, J.F., "The Effect of Changes in the Nutrient Income on the Condition of Lake Washington." Limnol & Oceanogr., 26:1 (1981).
49. Edmondson, W.T., Univ. of Washington, Seattle. Personal Communication to G. Fred Lee (1980).
50. Swenson, W.A., "Influence of Advanced Wastewater Treatment on the Fishery Resource of Shagawa Lake, Minn." U.S. Environ. Prot. Agency, EPA-600/3-80-036, Corvallis, Ore. (1980).
51. Simons, T.J., and Lam, D.C.L., "Water Quality Simulations for Lake Ontario." Unpublished Manuscript, Nat. Water Res. Inst., Canada Centre for Inland Waters. Burlington, Ontario, Canada (1979).
52. Bierman, V.I., "A Comparison of Models Developed for Phosphorus Management in the Great Lakes." In "Phosphorus Management Strategies for Lakes." Ann Arbor Science, Ann Arbor, Mich., 235 (1980).
53. Vallentyne, J.R., and Thomas, N.A., "Fifth Year Review of Canada-United States Great Lakes Water Quality Agreement." Report of Task Group III, A Tech. Group to Review Phosphorus Loadings, Great Lakes Regional Office, Int. Joint Commission, Windsor, Ontario, Canada (1978).
54. U.S. Department of State, "Great Lakes Water Quality Agreement of 1978." Agreement with Annexes and Terms of Ref., between the U.S. and Canada, signed at Ottawa, Ontario, November 22, 1978, U.S. Department of State, Washington, D.C. (1978).
55. Lee, G.F., et al., "Oxygen Depletion in the Hypolimnion of Lake Mendota, Wisconsin - Relationship to the Demise of the Cisco." Submitted for publication (1981).
56. Rast, W., and Lee, G.F., "Comments on paper by Smith, V. and Shapiro, J. 'Chlorophyll-Phosphorus Relationships in Individual Lakes: Their Importance to Lake Restoration Strategies, ES&T. 15:444 (1981)." Environ. Sci. & Technol. 15:1509 (1981).
57. Lee, G.F., "Eutrophication." Transactions of the Northeast Fish and Wildlife Conf. (1973).

Reference as: "Rast, W., Jones, A., and Lee, G. F., "Predictive Capability of US OECD Phosphorus Loading-Eutrophication Response Models," Journal Water Pollution Control Federation 55(7):990-1003 (1978)."

|
|