Eutrophication Modeling for Water Quality Management:
An Update of the Vollenweider-OECD Model
R.A. Jones and G.F. Lee
Department of Civil and Environmental Engineering
New Jersey Institute of Technology
Newark, New Jersey 07102, USA
INTRODUCTION
During the mid-1970s, the Organization for Economic Cooperation and Development (OECD) sponsored a 5-year study of the relationships between nutrient loading and eutrophication-related water quality response in waterbodies in the US, Canada, Australia, Japan, and 14 countries in Western Europe. One of the primary purposes for the OECD eutrophication study was to try to quantify, for a broad range of types of waterbodies, the relationships between the loading of nutrients, especially phosphorus, and the eutrophication-related water quality responses. About 35 waterbodies or parts of waterbodies in the US which had in the past been intensively studied for nutrient loading and response characteristics were included in this study, along with Canadian waterbodies which had previously been investigated. New studies were initiated on the water-bodies in the other participating countries. Previous editions of the Water Quality Bulletin (July and October, 1981) have provided discussions of the problems of eutrophication and the results of parts of the OECD eutrophication modeling study effort.
Because of the availability of data on the US waterbodies, this group was the first to be evaluated (Rast and Lee, 1978; Lee et al., 1978) following the theoretical approaches developed by Vollenweider. Vollenweider (1968, 1975, 1976) had begun to quantify relationships between nutrient loading and general conceptualizations of eutrophication-related water quality as assessed by "eutrophic", "mesotrophic", and "oligotrophic" designations, based on about 20 primarily European waterbodies. Vollenweider found that one of the relating factors was the mean depth of the waterbody; the greater the mean depth, the greater the phosphorus loading could be before "eutrophic conditions would be found. It reflects the greater dilution capacity of deeper waterbodies and proportionately smaller photic zones, allowing the deeper water-bodies to have a higher P load without stimulating greater amounts of algae. Vollenweider corrected for the effects of fast or slow flushing rates of water through a waterbody on the utilization of nutrients by planktonic algae, and for the impact of the surface area of the waterbody receiving light by including hydraulic residence time and water-body surface area as normalizing factors in his load-response relationships.
The focus on P loading in the Vollenweider-OECD eutrophication modeling approach was based on several considerations. It is phosphorus which most frequently controls algal growth in water-bodies; P control is more readily effected and is less costly than nitrogen control; and phosphorus can be more readily controlled at point sources than nitrogen. Furthermore, Schindler (1977, 1985) has shown that even in lakes exhibiting nitrogen limitation, algal growth responds to decreases in phosphorus load. The possibility of nitrogen fixation by algae also interferes with the use of nitrogen load in estimating or predicting waterbody algal responses.
Vollenweider (1976) developed a regression relationship for average planktonic algal chlorophyll concentration as a function of the annual P load, normalized by waterbody area (L(P)), mean depth (z), and hydraulic residence time (T~) for a group of European waterbodies. Following the same approach, Rast and Lee (1978) developed a line of best fit for the US OECD waterbodies; they found the regression to be essentially the same as that which had been developed by Vollenweider for his separate set of waterbodies. Jones and Lee (1982) updated the Rast and Lee line of best fit by including an additional approximately 40 US waterbodies on which data were available or on which they had worked; their line of best fit was essentially the same as that of Rast and Lee (1978). The focus on average chlorophyll concentration as the response parameter is justified for a number of reasons. As a measure of waterbody "greenness", it integrates the quantification of various types of planktonic algae. Furthermore, chlorophyll concentration can be related to many of the impairments of water use that result from algal growth.
Rast and Lee (1978) had also expanded the scope of the original normalized P loading/chlorophyll relationship concept by developing analogous relationships between normalized P loading and Secchi depth (water clarity) for waterbodies in which water clarity is controlled primarily by planktonic algae, and between normalized P loading and hypolimnetic oxygen depletion rate based on US OECD data and the literature. These relationships were also updated by Jones and Lee (1982); their three normalized P loading/eutrophication-related water quality response relationships are shown in Figure 1.
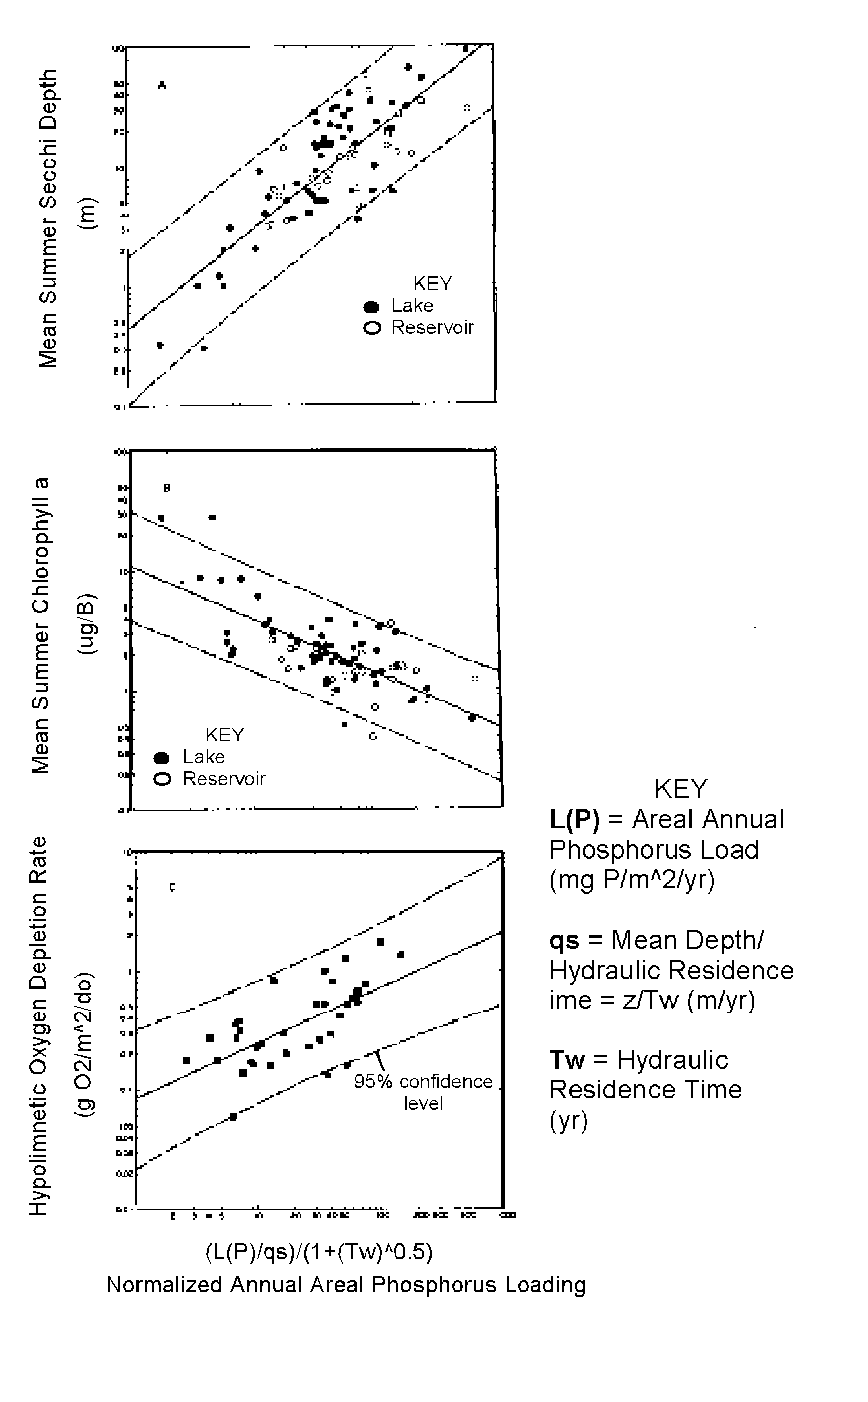
Figure 1. P Loading/eutrophication-related water quality response relationships for US waterbodies (after Jones and Lee, 1982).
NORMALIZED P.LOADIFISH YIELD
In addition to the relationships shown in Figure 1, the authors and others were independently developing relationships between eutrophication-related water quality characteristics and overall fish yield. Following the concepts of the Vollenweider-OECD eutrophication modeling approach, Lee and Jones (1985a) developed the relationship shown in Figure 2 based on information from the literature (Oglesby, 1977; Hanson and Leggett, 1982). This relationship indicates that the greater the normalized P load and hence the greater the algal bio mass supported, the larger the yield of fish. It also illustrates that achieving the typically most desirable aesthetic quality, i.e., low productivity, and achieving the most productive fishery are antagonistic goals for water/aquatic resources quality in a waterbody. If one were to plot yield of desirable fish as a function of normalized P load, however, there would likely be at least two breaks in the slope of the line of best fit in Figure 2 where the slope would decrease. One would correspond to that normalized P load which would cause sufficient algal growth to result in the depletion of oxygen in the hypolimnetic waters to preclude the existence of certain cold water, desirable fish, such as the salmonids. Also, in some highly eutrophic waterbodies, the fish may be stunted, considerably smaller in size, and hence less desirable. While other factors influence the production of desirable fish in a waterbody, the relationship shown in Figure 2 clearly shows the expected relationship between overall fish biomass and P loading and provides a starting point for defining these relationships in more detail. It will be especially useful in areas where the concern is primarily for food production rather than aesthetic enjoyment of waters.
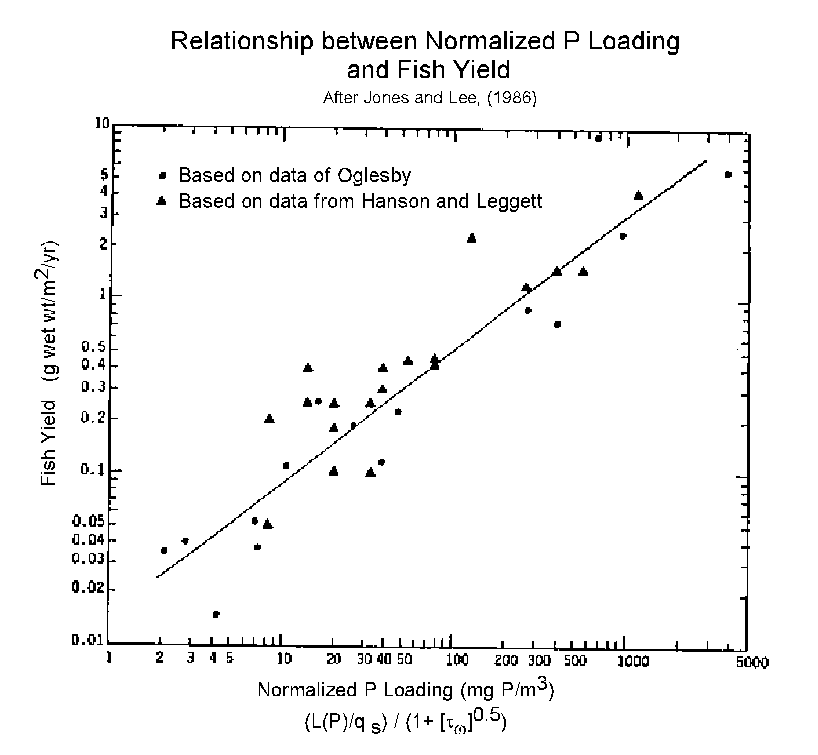
Figure 2. Normalized phosphorus loading/fish yield relationship (after Lee and Jones, 1985a).
DEMONSTRATION OF PREDICTIVE CAPABILITY
Perhaps the most important aspect of the Vollenweider-OECD eutrophication modeling approach is the demonstration and verification of the predictive capability of the relationship models. While there are other statistical models similar in principle to the Vollenweider-OECD load/response models, none has the extensive and varied data base, especially with this recent update, that the Vollenweider-OECD models have, which gives confidence in their widespread applicability to a wide variety of water-body types. The dynamic types of eutrophication models, and indeed other statistical load/response regressions, have not been demonstrated to have reliability in predicting new steady state eutrophication-related water quality characteristics after substantial P loading alterations. This step is
crucial to the use of any modeling approach for estimating the impact of nutrient control programs on water quality. The predictive capability of the Vollenweider-OECD models was reviewed in detail and demonstrated by Rast et al. (1983).
UPDATED NORMALIZED P LOADIEUTROPHICATIONRELATED WATER QUALITY RESPONSE RELATIONSHIPS
The work of the authors in the US and in other countries to explore the applicability of the Vollenweider-OECD P loading/eutrophication response modeling approach has continued beyond the original work to establish the load/response relationships. In their post-OECD work, the authors have applied the modeling approach to an additional approximately 40 waterbodies in the United States as well as about 60 waterbodies in other countries. Furthermore, for this evaluation, the authors also included the load/ response couplings for the approximately 185 Canadian and other non-US OECD waterbodies. The authors have found that the normalized P load/response relationships for these additional waterbodies are in keeping with those developed on the basis of the OECD and US OECD waterbodies. The updated Vollenweider-normalized P load/chlorophyll relationship is presented in Figure 3.
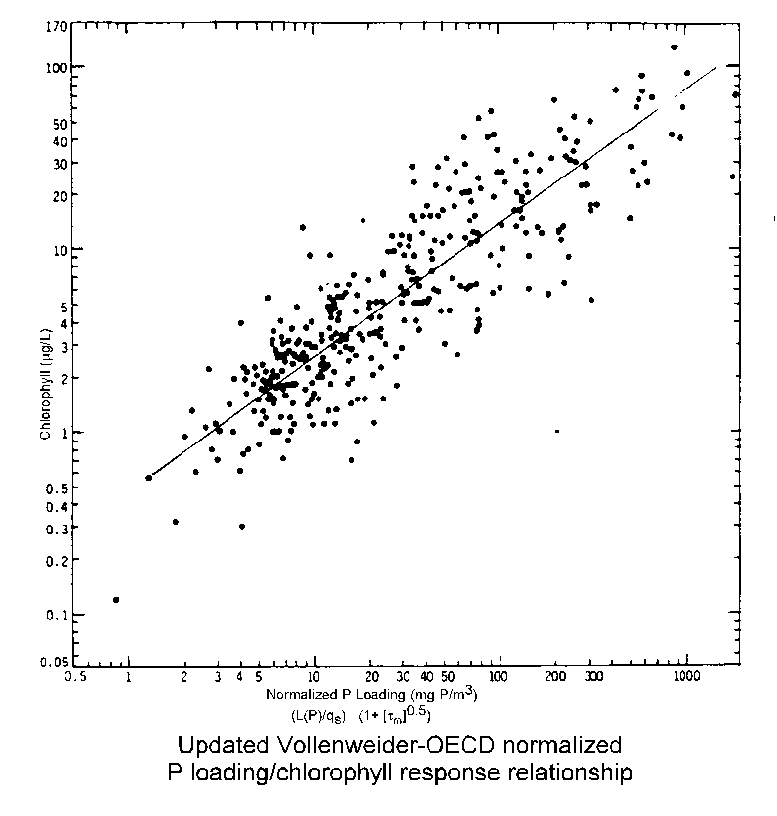
Figure 3. Updated Vollenweider-OECD response relationship.
Since the models were originally developed on the basis of water-bodies having a certain range of morphological and hydrological characteristics, the authors focused much of their post-OECD work on waterbodies with characteristics different from the waterbodies included in the original OECD study. Of special interest has been waterbodies which seemingly did not fit the US waterbody load/response relationships. Jones and Lee (1982) described the characteristics of many of the additional US water-bodies evaluated to that point through this approach. Presented below is a brief description of some of the additional waterbodies evaluated that comprise the most recent update in the VollenweiderOECD P load/chlorophyll response relationship.
Additional Waterbodies
Many
of the waterbodies evaluated in the QECO eutrophication study and post-OECD work of the authors were moderately fertile to oligotrophic; few were classified as hyper-eutrophic. In their post-OECD work the authors had the opportunity to study a number of hyper-eutrophic waterbodies, among them Fossil Creek Reservoir near Fort Collins, CO. This reservoir receives essentially its entire water input as secondarily treated domestic wastewater (Lee and Jones, 1982). The load/response coupling for this waterbody helped define the upper reach of the updated relationship (Figure 3), which appears as an extension of the line of best fit developed based on more moderately fertile waterbodies. Lee and Winkler (1984) found that the load/response relationships for Lake Olathe, a water supply reservoir in Kansas, were the same as the other waterbodies evaluated using this approach. Lake Olathe is one or a small group of waterbodies evaluated in which the algal growth is driven by diffuse (non-point) sources of P; it has no point source discharges of P to it.The authors have been involved in a considerable amount of international work in eutrophication evaluation and management beyond the work conducted through OECD. In the late 1970s they had the opportunity to apply the OECD eutrophication modeling approach to Lake Mjosa near Oslo, Norway. There were questions as to whether this waterbody would follow the same relationships as other waterbodies because of its great depth; the mean depth is more than 150 m. For each of the several years of data available, it was found that the load/response relationships for this waterbody were, indeed, as expected based on the OECD relationships (Jones and Lee, 1980).
The authors served as technical advisors of a five-year study of P load/response relationships for about 20 of Spains approximately 600 reservoirs, for the purpose of establishing a foundation for Spain to develop eutrophication management approaches. Approximately three years of data were collected on the P loading and chlorophyll, Secchi depth, and oxygen depletion rates in the waterbodies studied. These relationships as well were in keeping with those developed on the basis of the US OECD data (Jones and Lee, 1986; Ortiz et al., 1983) and form part of the data base for the updated regression.
The authors have encountered situations in their work where reports and papers have been published indicating that the Vollenweider-OECD approach is not applicable to a certain waterbody or group of waterbodies. These cases are always of interest as it has become an oddity worthy of study when a waterbody does not follow these relationships. Such a situation was encountered with a group of reservoirs in South Africa. The results of a several-year eutrophication study of 21 reservoirs in South Africa were published in a report by Walmsley and Butty (1980) indicating that the Vollenweider-OECD approach was not appropriate for those waterbodies. The authors obtained the data of Walmsley and Butty, made the calculations to normalize the loads, etc., and found that all but three did, indeed, follow the US waterbody normalized P loading/chlorophyll response relationship. Updated information provided by Hart (1983) showed that the three which initially had appeared not to fit the model actually did respond in accord with what would be expected based on the load/response couplings of the waterbodies making up the US waterbody lines of best fit (Jones and Lee, 1983a). Grobler (1984) provided data which showed that Hartbeespoort Reservoir near Pretoria, South Africa, which had not been included in the work of Walmsley and Butty (1980), also followed the same relationships (Jones and Lee, 1983b).
A similar skepticism arose in statements made by White (1983) regarding the applicability of the OECD eutrophication modeling approach to waterbodies in New Zealand. However, using the data published by White (1983), the authors found that these nearly 30 waterbodies, as well, followed the expected relationship.
The ultra-oligotrophic Lake Vanda in Antarctica is certainly one of the most unusual in the world. This meromictic lake which has a permanent 4-in deep ice cover is fed by glacial melt waters which flow for about two months each year. It is 67 m deep and it has a Secchi depth of 22 m. It is chemically and thermally stratified, with the surface waters at 00C and the bottom, hypersaline waters about 250C. With its mean chlorophyll concentration of 0.12 m g/L, this waterbody helps define the low end of the P loading/ chlorophyll response relationship (Figure 3); it fits within the family of points which comprises the updated OECD line of best fit (Jones et a/., 1986). Schindler (1985) reported that the Canadian Char Lake, which has a 2-in ice cover for 11 to 12 months each year, also fits the relationship well, further defining the lower end of the model.
During the past several years, the second author has served as an advisor to the Argentina government on evaluating and managing eutrophication in its waters. One of the waterbodies of focus was Salto Grande Reservoir on the Uruguay/ Argentina border. This is a highly turbid, moderately fertile system with several major arms. The P load/response relationships determined from each of the three years of data available on the waterbody proper and the one year of data available on the major arm of this reservoir followed those expected based on the US OECD load/ response relationship (Beron and Lee, 1984). In addition, recent studies have shown that Lacar Lake, an oligotrophic waterbody in the mountains of the Chile/Argentina border, that has an average summer chlorophyll concentration of 0.7 m /L, also fits these relationships (Beron, 1985).
The authors have also made evaluations of the load/response relationships for a number of other waterbodies, the results of which have not yet been published. These include King Talal Reservoir near Amman, Jordan, and the Lake of Tunis outside of Tunis, Tunisia. Preliminary evaluations made by the authors based on the data available indicated that both of these water-bodies follow the P loading/ chlorophyll response relationship illustrated by the US waterbody line of best fit.
Neither the US OECD normalized P load/eutrophication response relationships nor the 1982 updated relationships of Jones and Lee (1982) included the non-US waterbodies evaluated either as part of the QECO study or the follow-on work by the authors. The results of the overall OECD eutrophication study were summarized by Vollenweider and co-workers (OECD, 1982). These data were included in this updated load/response relationship (Figure 3), as were the results of the Canadian portion of the QECO study published by Janus and Vollenweider (1981). From the data presented by Janus and Vollenweider, 134 load/response couplings were added to the formulation of the updated relationship.
Overall, the body of data available to these authors at this time covers a broad spectrum of waterbodies. Small waterbodies of a hectare area to large waterbodies such as Lake Superior with a surface area of 8 million hectares are included. Water-bodies with depths ranging from a shallow 1.5 m to a maximum depth of about 500 m (Lake Superior) are included. Hyper-eutrophic Fossil Creek Reservoir, with a mean chlorophyll concentration of more than 100 m /L, follows the same relationship as Lake Tahoe with a mean chlorophyll concentration of 0.1 m /L. Lakes, reservoirs, and the two estuarine systems evaluated all behave in the same manner as far as their planktonic algal response to normalized phosphorus loading. Those in warm climates such as Texas and Florida (which have summer surface water temperatures on the order of 350C) and those in the cold Nordic and Antarctic climates behave the same in utilization of phosphorus for the growth of planktonic algae. Waterbodies in the Northern Hemisphere countries have the same load/response relationships as those in the Southern Hemisphere. (Some difficulties have been encountered in using this approach for highly turbid or colored waterbodies. However, the authors have observed that if the Secchi depth not related to planktonic algae is greater than or equal to about 0.3 m, the turbidity and/or color do not seem to interfere with the amount of algae produced based on the normalized P loading.) For no other modeling approach has this broad a spectrum of waterbody types been included.
New Normalized P Load/Chlorophyll Response Relationship
Figure 3 shows
the positions of all of the waterbodies evaluated to date the US OECD, international QECO, and the additional US and non-US waterbodies studied by the authors, on the Vollenweider-OECD normalized P-load/chlorophyll plot. The line of best fit was determined by a simple linear regression. Comparison of this figure with graph A of Figure 1 shows that the lines of best fit are essentially the same. The fact that more than 325 data points describe the same relationship as described previously with the US data, and the fact that these waterbodies represent as wide a range of waterbody morphological, hydrological, biological, and chemical characteristics as they do demonstrates the universality of this relationship. The fact that this relationship is based on the behavior of such a large number of individual waterbodies of varying characteristics provides an internal verification of the ability of this model to predict the changes in eutrophication-related water quality response as measured by chlorophyll that will result from changes in the normalized P loading to the waterbody. It is clear that, independent of just about everything else, if the phosphorus load to any waterbody is normalized by the waterbodys mean depth, hydraulic residence time and surface area, and an initial load/ response coupling is known, the planktonic algal chlorophyll concentration that will occur after the waterbody has reached a new equilibrium can be reliably estimated for this new loading. This, coupled with the "before" and "after" P load, changes demonstration of predictive capability (Rast et al., 1983), and gives a considerable level of confidence in using this approach to estimate expected changes in eutrophication-related water quality that will result from alterations in the P loading.CONCERNS REGARDING APPLICABILITY OF VOLLENWEIDER-OECD EUTROPHICATION MODELING APPROACH
A number of comments and concerns are periodically- raised by some individuals regarding the utility of the Vollenweider-OECD eutrophication modeling approach. While these have been addressed in previous publications (e.g., Rast and Lee, 1978; Jones and Lee, 1982; Rast et a/., 1983; and Lee and Jones, 1985b), it is appropriate to discuss them here since they continue to be raised.
Log/Log Plot
The fact that these load/response relationships are expressed on a log/log grid and cover several orders of magnitude seems to indicate to some that the relationships are tenuous at best. The fact that normalized nutrient loadings to water-bodies around the world and likewise chlorophyll concentrations span several orders of magnitude is not unexpected. It reflects the variety of conditions encountered and evaluated. As discussed by Janus and Vollenweider (1981), the expression of the regression as a log/log straight line relationship is in part a convenience because of the range of values covered but, more importantly, is justified by statistical considerations. Their discussion should be consulted for further details of the statistical justification for this. It is important to point out that this transformation in no way alters the validity of the relationships.
Confidence Intervals
On a number of the OECD loading/response regressions, lines describing the 950/a confidence interval for the points making up the line have been included. As seen in Figure 1, these "confidence intervals" span about an order of magnitude in the response parameters. This has been a source of concern for a number or individuals because they inappropriately assume that it represents the confidence interval around the predicted response values for altered loadings to a waterbody. A recurring misconception is that, because of the size of these "confidence intervals", a prediction of response to altered conditions can be an order of magnitude or more different from that which will actually occur after the P loading change. It is because of this type of misconception that the "confidence intervals" were not included in Figure 3, and the discussion below is provided.
As discussed by Rast et al. (1983), if one knows nothing about the eutrophication-related water quality characteristics of the waterbody, or its chlorophyll, Secchi depth, or hypolimnetic oxygen depletion rate, and wishes to estimate the plank-tonic algal chlorophyll concentration expected based on the normalized P loading, then the best estimate would be the point on the line of best fit corresponding to the normalized loading. Under these conditions, the 95% confidence interval about the estimated chlorophyll value would be represented by the intervals shown in Figure 1 where the estimate may be in error by a factor of 5 or so. However, if a load/response coupling for the waterbody can be identified, i.e., if sufficient data were available to plot the load/response point for the waterbody, the confidence interval around the chlorophyll level prediction for altered loading conditions would be reduced considerably. This was illustrated by Rast et a/. (1983) who plotted the actual pre-Pload change and post-change points. For each point, the chlorophyll concentration predicted based on the line of best fit and the normalized P load was within a factor of 2 of the measured value. Most of the measured values were well within a factor of 1.5 of the predicted values.
As discussed by Rast and Lee (1978), Jones and Lee (1982), and Rast et al. (1983), the conditions and characteristics of a waterbody which cause it to plot at some distance from the line of best fit tend to keep the waterbodys load/ response coupling the same distance from the line independent of the normalized loading. Thus if, for example, a waterbody has a higher than typical amount of unavailable P in its total P load, it may plot somewhat below the line of best fit, since, per unit phosphorus, its load will grow fewer algae. Unless the proportions of available and unavailable P in the loading are significantly altered along with the total P load alteration, the new load/response coupling for the altered loading conditions would be located at the intersection of a line drawn through the pre-change load/response coupling parallel to the line of best fit, and one drawn perpendicular to the abscissa through the new normalized P loading value. Therefore, based on the theoretical concepts of the modeling approach as well as the data available for pre-load reduction/post-load reduction load/response comparisons relative to predicted response, the size of the confidence interval for the points comprising the line of best fit is unrelated to the predictive capability of the approach as long as a load/response coupling for the waterbody in question can be identified.
While the size of the confidence intervals may appear to be a drawback to the use of this approach for a reservoir that has not yet been built or one for which no data exist, the significance to water quality management of the potential error should be evaluated before the approach is dismissed as inappropriate. It is likely that the need for or impact of phosphorus removal from point source discharges such as domestic wastewater treatment plants, for example, can be estimated with adequate reliability for making management decisions by using this approach as long as the waterbody is not expected to have unusual hydrological, morphological, or phosphorus loading characteristics (Lee and Jones, 1984). The delta chlorophyll -- the expected change in chlorophyll -- that will be identified to result from this management practice can still be estimated to determine whether the suggested management practice will result in a noticeable improvement in eutrophication-related water quality/beneficial uses of the waterbody. For example, if the estimated loading to a waterbody is 30 mg P m-3, with no other response information and using the line of best fit in Figure 3, the estimated chlorophyll concentration would be about 5 m g/L. Based on the confidence units, it could be expected to be as low as 1.4 m g/L or as high as 22 m g/L. Using the 5 m g/L estimate, if the removal of P, for example, from a domestic wastewater discharge to the system would decrease the loading to 10 mg P m-3, the chlorophyll would be expected to be reduced to 2.5 m g/L. If the high-end estimate of initial chlorophyll (22 m g/L) were used, it would be predicted that the chlorophyll concentration that would result from the P load reduction would be 10 m g/L Similarly, if the low-end estimate of the initial chlorophyll concentration (2.5 m g/L) were assumed, the predicted chlorophyll concentration would be 0.7 m g/L. While the numeric values of the estimated post-load-change chlorophyll concentration are different, an assessment of the degree of improvement in eutrophication-related water quality for the given beneficial uses of the water can nonetheless be made. In this example, in all three cases, it would generally be concluded that the impact of this management option would result in a noticeable improvement in the eutrophication-related water quality characteristics. Lee and Jones (1985b) provide insight into what constitutes a "noticeable" change in chlorophyll in terms of the beneficial uses of a waterbody. Typically, about 20 to 25% reduction in P load must occur before the change in chlorophyll is "noticeable" to the public. It should also be realized that none of the other techniques used for predicting the impact of phosphorus control strategies have better known reliability; the reliability of the predictions from other approaches has not been defined. In addition, most other approaches cannot even be used in this type of situation because of their considerably larger data requirements to tune the model to the system. Such tuning, in itself, is one of the primary deficiencies in the use of deterministic/dynamic modeling approaches for predictive purposes.
"My Waterbody Is Unique"
There is a tendency among investigators to believe that the water-bodies they have studied and that are located in their region are unique in the world. This does not appear to be a technically supported perspective based on the data assembled here and the efforts of the authors to find waterbodies which do not fit the same pattern of P load/response relationships. As discussed previously, the waterbodies which form the foundation and structure of the updated Vollenweider-OECD normalized P load/response relationships include small and large, shallow and deep, warm-climate and cold-climate, hyper-eutrophic and oligotrophic, bowl-shaped and run-of-the-river waterbodies, as well as a myriad waterbody types in-between.
The reason for the universal applicability of this approach is that it is based on how algae use nutrients in making more algal biomass. It is based on the utilization of carbon, nitrogen, and phosphorus in the approximate atomic stoichiometric ratios of 106 to 16 to 1. It takes into account that there is some recycling of nutrients from internal sources, and that some of the nutrient input is unavailable for growth of algae.
In the original development of the Vollenweider-OECD eutrophication modeling approach it was believed that it would be applicable only to those waterbodies in which plank-tonic algal growth was limited by the availability of phosphorus. As discussed previously, this has now been shown not to be a necessary condition for its application. The normalized P loading is theoretically equivalent to the steady state in-lake P concentration; the data support this with a slight correction. The original US OECD data base included waterbodies having normalized P loadings generally between 6 and 200 mg m-3. The waterbodies added to the data base by this and the previous update of the regression have expanded the range of loadings of the waterbodies to those having more than 1000 mg P m-3 loading; waterbodies with this level of P loading typically have algal-available P -- soluble ortho P -- that goes unused during periods of maximum growth. Examination of Figure 1 shows that the regression line at the upper end of the scale, covering the waterbodies having equivalent average P concentrations of several tenths of a mg per litre, is an extension of the line developed for the waterbodies having more moderate average P concentrations. The additional data also extend the original regression at the lower end of the loading scale.
The seeming universality of this approach, however, must never be taken for granted. As discussed by Jones and Lee (1982) and Rast et al. (1983), this approach should not be used blindly or mechanically in a manner that disregards the particular characteristics of a water-body. Furthermore, while the updated line of best fit extends the P loading range over which the approach has been defined, caution must be exercised in using the regression at the upper and lower limits. It appears that the relationship would tend to flatten out at the upper end and also curve downward at the lower end (Vollenweider, 1985). This is in keeping with the experience of the authors in evaluating the behavior of waterbodies. The approaches outlined by Jones and Lee (1982), Rast et a/. (1983), and Lee and Jones (1985b) should be followed in evaluating if the characteristics of a waterbody are truly outside a range for which the approach can be readily applied, and in applying this approach to those waterbodies having unusual characteristics.
CONCLUSIONS
The updated Vollenweider-OECD normalized phosphorus loading/ eutrophication-related water quality response model is based on data from several hundred waterbodies around the world. With few exceptions, the waterbodies that have been examined by the authors have been found to have their phosphorus load/eutrophication response relationship described by the relationship discussed herein. The few that have not fit have had readily identifiable characteristics which are expected to preclude application of the approach. The authors estimate, based on their discussions with colleagues who have applied the approach but have not published their data, that there have been several hundred additional waterbodies not included in the updated load/response relationship which have been evaluated by others and found to follow the same relationship. This makes the total number of waterbodies which are known to follow the Vollenweider-OECD normalized-P load/response relationship on the order of 500; the number is limited by the number of studies done, not by the fraction of waterbodies studies which were found to fit the relationship.
Not only has the predictive capability of these models to estimate the change in eutrophication-related water quality response characteristics that will result from altered nutrient loading been demonstrated, but this is also the only approach for which such demonstration has been made for a wide variety of waterbodies.
It is recommended that the Vollenweider-OECD eutrophication modeling approach be used in developing eutrophication management strategies for waterbodies. The authors are interested in receiving information from any investigator who finds that this approach seems not to be applicable to a particular waterbody.
ACKNOWLEDGEMENT
Support for this paper was provided by the Department of Civil and Environmental Engineering and the Office of Sponsored Programs at the New Jersey Institute of Technology, Newark, New Jersey. This paper was presented at the International Conference on Management Strategies for Phosphorus in the Environment, Lisbon, Portugal, in July 1985.
The authors wish to acknowledge the significant contributions made to the field of eutrophication management by Dr. R.A. Vollenweider in his development of this approach. They greatly appreciate the time he has taken in dialogue with them regarding their application of the approach. The authors also appreciate the assistance of Dr. D.W. Schindler in reviewing the manuscript.
REPERENCES
Beron, L.. and G.F. Lee, 1984. Applicacion preliminar de un modelo de eutrofication al Embalse de Salto Grange. Proc De AIDIA XIX Congreso Interamericano de Ingenieria Sanitaria y Ambiental tot 2, Santiago-Chile (in Spanish).
Beron, L., 1985. Eutrophication-related water Quality of Lacar Lake, Argentina (in press).
Grobler, D , 1984. Institute for Environmental Sciences, University of tne Orange Free State. Bloemfontein. South Africa. Currently with National Institute for Water Research, Pretoria. South Africa. Personal communication to G. Fred Lee.
Hanson, J. and W. Leggett. 1982. Empirical prediction of fish biomass and yield. Can. J. Fish Aquat. Sci. 39: 257-263.
Hart, R C., 1983. Professor of Limnology, Rnodes University, Grahamstown, South Africa. Personal communication to G. Fred Lee.
Janus, L.L., and R.A. Vollenweider, 1981. Summary report: The CECO Cooperative Programme on Eutrophication -- Canadian contribution Scientific Series No. 131 and 131-S, Canada Centre for Inland Waters, Burlington. Ontario, Canada.
Jones, R.A., and G.F. Lee, 1982. Recent advances in assessing the impact of phosphorus loads on eutrophication-related water quality. Journ. Water Research 16: 503-515.
Jones, R.A.. and G.F. Lee, 1 983a. Application of OECD eutrophication modeling approach to South African impoundments. Occasional Paper No. 87, Department of Civil and Environmental Engineering, New Jersey Institute of Technology, Newark, N.J.
Jones, RA., and G.F. Lee, 1983b. The impact of altering phosphorus loads on eutrophication-related water quality in Hartbeespoort Dam. Occasional Paper No. 88. Department of Civil and Environmental Engineering, New Jersey Institute of Technology, Newark, N J.
Jones, R.A.. and G.F. Lee, 1986 Applicability of the US OECD eutrophication models to Spanish impoundments (in press).
Jones, R.A., G.F. Lee, W J. Green. and D Canfield. 1986 Application of Vollenweider-OECD eutrophication modeling to Lake Vanda. Antarctica (in press).
Lee, G.F and R.A. Jones. 1982. Impact of Fort Collins domestic wastewater discharges on water Quality in Fossil Creek and Timnath Reservoirs Report to Fort Collins Department of Public Works. G Fred Lee & Associates, Maplewood. N.J.
Lee, G.F. and R.A. Jones. 1984 Predicting domestic water supply raw water quality in proposed impoundments In American Water Works Association 1984 Conference Proceedings. pp. 1611-1630
Lee, G.F. and R.A. Jones. 1985a. Impact of eutrophication on fisheries. Prepared for American Fisheries Society (in press.
Lee, G.F. and R.A. Jones. 1985b. Evaluation of the effectiveness of phosphorus removal from domestic wastewaters on the eutrophication Of receiving waters. Presented at International Conference on Management Strategies for Phosphorus in the Environment. Lisbon.
Le. G F. and B. Winkler. 1984. Management of water Quality in Lake Olathe Report to the City of Olatne, KS Occasional paper of Department of Civil and Environmental Engineering, New Jersey Institute of Technology, Newark, N J.
Lee, G.F. W Rast, and R.A. Jones, 1978. Eutrophication of waterbodies: Insights for an age-old problem. Environ. Sci. & Technol. 12. 900-908.
Oglesby, P T . 1977. Relationships of fish yield to lake phytoplankton standing crop production, and morphoedaphic factors. Journal of the Fisheries Research Board of Canada 34: 2271-2279.
Organization for Economic Cooperation and Development (OECD). 1982. Eutrophication of waters monitoring, assessment, and control. OECD. Paris.
Rast, W. and G.F. Lee. 1978. Summary analysis of the North American (US portion) OECD eutrophication project: Nutrient loading-lake response relationships and trophic state indices. EPA-60013-78-008 US EPA.
Rast, W., R.A. Jones. and G.F. Lee. 1983 Predictive capability of US OECD phosphorus loading/eutrophication response models Journ. Water Pollut. Control Fed. 55. 990-1003.
Schindler, D.W. 1977. Evoluation of phosphorus limitations in lakes. Science 195. 260-262
Schindler, D.W. 1985. Project Leader. Experimental Limnology, Canada Centre for Inland Waters, Winnipeg. Manitoba. Canada. Personal communication to G.F. Lee.
Vollenweider, R.A. 1968. Scientific fundamentals of the eutrophication of lakes and flowing waters, with particular reference to nitrogen and phosphorus as factors in eutrophication OECD. Paris. Tech Report DA 515C1168 27. 250 p.
Vollenweider, R.A. 1975. Input-output models with special reference to the phosphorus loading concept in limnology. Scttweiz. A. Hyorol 37: 53-84
Vollenweider, R.A. 1976. Advances in defining critical loading levels for phosphorus in lake eutrophication. Mem.lst. Ital.. Idrobio. 33: 53-83.
Vollenweider, R.A. 1985. Canada Centre for inland Waters. Burlington. Ontario. Canada. Personal communication to G. F Lee.
Walmsley, R.D., and M. Butty. 1980. Guidelines for the control of eutrophication in South Africa. Water Research Commission and National Institute for Water Research Council for Scientific and Industrial Research. UDC 574524 (680) Pretoria, South Africa.
White. E.. 1983. Lake eutrophication in New Zealand -- A comparison with other countries Of the Organization for Economic Cooperation and Development. New Zealand Journal of Marine and Freshwater Research 17. 437-444.

Reference as: "Jones, R. A. and Lee, G. F., 'Eutrophication Modeling for Water Quality Management: An Update of the Vollenweider-OECD Model,' World Health Organization's Water Quality Bulletin 11:67-174, 118 (1986)."

|
|